User interface > Debugging and executing > Variable-Inspector
By the variable-inspector you can look at the contents of the variables of the actual scope of a debugging session.
If you are in the debugging mode (not during a look-ahead, see below), you get the window of the variable-inspector by the button
![]()
or by the according item in the start menu
You can either write the name of a special variable into the field of the combo box at the left top of the dialog or select one of the five predefined items:
class variables
If you choose the item class variables, the source and target information are shown as well as all variables, which are defined on the element page. (The parser itself is denoted as this or (*this).)
local variables
If you choose the item local variables, the values of all variables are shown, which are in the actual scope. These are the variables passed to the actual production and the variables, which are locally declared in the production.
xState (parser state)
If you choose the item xState, all elements of the parser state variable are shown, including all sub-expressions of the last recognized token.
Plugin Variables
If you choose the item Plugin variables, all variables of the plugin are shown, especially the source and target specification and the state of the indentation and scope stack.
DOM
If a DOMDocument has been created, it can be viewed here.
.
Buttons of the toolbar
Up in the hierarchy ![]()
With the Back-button you can go a level higher in the hierarchy of the class elements or finally to a view of all variables of a visibility area (see above).
Actualize ![]()
After you have opened the variable-inspector, you have to actualize the value of an eventually already chosen variable by the actualize button.
Details = ![]()
Choice of a single variable by double click
If several variables are shown, you can select one of them with the left mouse button on the value side and view their content by the Detail-button or by a double click. So longer texts or the elements of containers or tree structures - like shown below - can be seen.
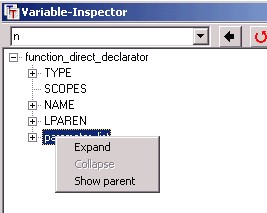
In a tree view nodes can be selected with the right mouse button. Then you can expand or collapse the whole branch, if you chose the corresponding items in the pop-up menu. You also can move the root of the tree to it's parent node.
Stay on top
If the check box Stay on top is actualized, the variable-inspector remains visible on top of the screen during the complete debugging-session. After each debugging step the content of the selected variable is actualized automatically. If stay on top is not set, there will be no such actualization and the inspector will be deleted from the screen by each step.
If the inspector is closed, while the check box is checked, it will be unchecked.
If it is a complex variable, as for example the xState-variable, the values of its class elements will be listed. In some cases some properties of the variables will be added to the list of values. As containers (mstrstr, vstr) can contain very much elements, for them only the number of elements is shown.
When debugging a look-ahead the variable inspector isn't shown because during a look-ahead no semantic actions are executed.